Go to Top Go to Bottom
Anim Biosci > Volume 37(5); 2024 > Article
Jung, Lee, and Oh: A genome-wide association study on growth traits of Korean commercial pig breeds using Bayesian methods

Abstract

Objective

This study aims to identify the significant regions and candidate genes of growth-related traits (adjusted backfat thickness [ABF], average daily gain [ADG], and days to 90 kg [DAYS90]) in Korean commercial GGP pig (Duroc, Landrace, and Yorkshire) populations.

Methods

A genome-wide association study (GWAS) was performed using single-nucleotide polymorphism (SNP) markers for imputation to Illumina PorcineSNP60. The BayesB method was applied to calculate thresholds for the significance of SNP markers. The identified windows were considered significant if they explained ≥1% genetic variance.

Results

A total of 28 window regions were related to genetic growth effects. Bayesian GWAS revealed 28 significant genetic regions including 52 informative SNPs associated with growth traits (ABF, ADG, DAYS90) in Duroc, Landrace, and Yorkshire pigs, with genetic variance ranging from 1.00% to 5.46%. Additionally, 14 candidate genes with previous functional validation were identified for these traits.

Conclusion

The identified SNPs within these regions hold potential value for future marker-assisted or genomic selection in pig breeding programs. Consequently, they contribute to an improved understanding of genetic architecture and our ability to genetically enhance pigs. SNPs within the identified regions could prove valuable for future marker-assisted or genomic selection in pig breeding programs.

INTRODUCTION

The pig breeding industry is comprised in several layers [1]. Due to these structural characteristics of the industry, the maternal and paternal lines are separated and selected, respectively, maximizing hybrid vigor in the crosses. In addition, since breeding pigs are maintained through generations of candidate selection by performance tests, the genes of the selected individuals are transferred to the lower layer and used to produce excellent finishers [2]. Therefore, the performance of breeding pigs is a factor that determines competitiveness in the pig industry. Since it takes a long time to move traits from purebreds to finishers, the ripple effect on the improvement of excellent breeding pigs is very large. In domestic Korean GGP farms, the main breeds used are the Yorkshire, Landrace, and Duroc purebreds.
In pig breeding programs, growth traits are economically important indicators of pig production performance and affect farm profits. Adjusted backfat thickness (ABF), average daily gain (ADG), and days to 90 kg body weight (DAYS90) are vital growth-related traits that are used to measure growth rate because of their significant impact on production efficiency [3]. Effectively managing and improving these traits can lead to higher production efficiency, better profitability, and a more sustainable and competitive pig farming operation. Pigs that grow faster with optimal backfat thickness and reach market weight more quickly are cost-effective for producers. Therefore, improvements in growth traits are necessary in the pig industry.
With the development of DNA technology that incorporates statistical methodology, it has become possible to study quantitative trait loci (QTL) or candidate genes [4,5]. Genome-wide association studies (GWAS) are a powerful approach in genetics and genomics to identify genetic variants (single nucleotide polymorphisms [SNPs]) associated with specific phenotypic traits or diseases, and are widely used to detect effective causal alterations and define narrow genomic regions in contact with these alterations [6]. In association analysis, DNA markers related to major genes can be identified because a SNP chip that covers the entire genome is densely integrated with SNP markers.
Bayesian methods in GWAS are invaluable when dealing with a large number of SNPs and a relatively small number of individuals [7]. In addition, by specifying an appropriate prior distribution for a SNP effect, only the effect affecting the phenotype is fitted to the model, and a small SNP effect is assumed to be zero depending on its π-value (a measure of statistical significance). By setting a threshold for SNP effects, the number of false positives during analysis can be controlled. SNPs with small effects that do not pass this threshold may be considered as not having a significant impact on the phenotype. Therefore, it is advantageous to find the candidate region for GWAS because the inferences are based on joint posterior distribution, which accounts for all unknown parameters [8,9]. Furthermore, it is possible to increase the efficiency of genetic improvement in livestock by increasing the accuracy of genetic ability evaluation through additional information on DNA markers with significant effects discovered during GWAS [10].
The aim of this study was to identify significant regions and candidate genes related to ABF, ADG, and DAYS90 in commercial Korean GGP pig (Duroc, Landrace, and Yorkshire) populations. This was achieved by conducting a GWAS using SNP chip platforms and the Bayesian method (BayesB with response variable).

MATERIALS AND METHODS

Phenotypic data

In this study, phenotypic data were collected from purebred Duroc (38,941), Landrace (23,451), and Yorkshire (91,146) pigs raised at a GGP farm in Korea between 2005 and 2022. The ADG was obtained from the difference in final weight and initial weight divided by the number of feed intake days. The BFAT was calculated based on the average fat thickness values of the shoulder (on the fourth thoracic vertebrae), mid-back (on the last thoracic vertebrae), and loin (on the last lumbar vertebrae) measured using an amplitude mode (A-mode) ultrasound device (PIGLOG 105). The DAYS90 was estimated according to the suggestions of the Korean Swine Performance Recording Standards (KSPRS), following previously reported procedures [3].

Genotypic data

Genomic data were collected using the Affymetrix Axiom 53K, Affymetrix Axiom 650K (Affymetrix Inc., Santa Clara, CA, USA), and Illumina Porcine SNP60K v2 (Illumina, Inc., San Diego, CA, USA) platforms.
A total of 5,359 pigs were included in the analysis. Specifically, 1,029 Duroc pigs were genotyped using Illumina60Kv2 (818 pigs) and Axiom650K (211 pigs), 472 Landrace pigs were genotyped using Axiom650K (143 pigs) and Illumina60Kv2 (329 pigs), and 3,858 Yorkshire pigs were genotyped using Axiom53K (479 pigs), Illumina60Kv2 (2,932 pigs), and Axiom650k (447 pigs).
SNP markers without map information, those existing on sex chromosomes, and those with a call rate of 0.95 or less and genomic data that overlapped were excluded from the analysis. In total, 43,861, 52,580, and 52,403 SNPs from Duroc, Landrace, and Yorkshire pigs, respectively, were used for the analysis. The collected genomic data were analyzed by imputation with a medium-density (MD) platform (Illumina Porcine SNP60Kv2) using FImuteV3 [11] for each breed (Table 1). Since the FImputeV3 program does not provide an r-square value, the imputation accuracy was estimated using leave-one-out cross validation.

Statistical methods

Estimation of genetic parameters

To estimate the genetic parameters, a linear animal model including additive genetic effects and fixed effects (sex, contemporary group) was applied to the multivariate model. The likelihood function logarithm (loge L) was used to determine the most appropriate models for the trait. The analysis was performed using the ASREML4.1 program [12], and the analysis model was as follows:
y=Xb+Zaua+e
where y is the vector of observation (ABF, ADG, DAYS90), X and Za are the incidence matrices for fixed and random effects, ua is the vector of the additive genetic effect, and e is the vector of the residual effect.

Response variables

Response variables for genomic analysis were estimated using estimated genetic parameters, variance components, estimated breeding values (EBV), and reliability according to the model for the genetic evaluation of each trait. Genomic analysis typically involves estimating response variables for specific traits. In this case, the response variables are related to growth traits such as ABF, ADG, and DAYS90. The estimates of genetic and residual variances and heritability for these traits are shown in Table 2.
Deregressed estimated breeding values (DEBV) including parent average were re-estimated using the EBV and reliabilities of each individual to help provide more accurate and reliable estimates of an individual’s genetic merit, particularly in situations where data is limited or unreliable. In addition, the weighting factor was calculated using the following formula [10]:
ωi=(1-h2){c+[1-ri2ri2]}h2
where ri2 is the reliability of EBVs, h2 is the heritability of each trait, c is the genetic variance ratio explained by the SNP marker information assumed to be 0.4 [13]. The weighting factor was then applied to the GWAS to explain the heterogeneous variance resulting from the different reliabilities of each individual from the re-estimated response variables.
Once the response variables were converted into DEBVs, GWAS was performed after removing individuals with a reliability (reliability EBVs – reliability of parent average) of 0.1 or less.

Bayesian Method for GWAS

To estimate the effects of SNP markers for GWAS analysis, BayesB with a fixed π value of 0.99 was used [14]. This analysis usually employs a high-density marker dataset which contains an extensive number of genetic loci as well as multiple samples for each locus. Therefore, a more targeted analysis was performed by focusing on identifying candidate gene regions. Parameters and effects were obtained using Gibbs sampling for a total number of 50,000 Markov chain Monte Carlo (MCMC) iterations and a sampling interval (thinning) of 5. The first 5,000 MCMC iterations were discarded for burn-in before estimating posterior means of marker effects and variances. As autocorrelation occurs within the Markov chain, it was carried out to prevent the occurrence of bias in advance, and the response variable was estimated as follows:
yi=μ+j=1kZijujδj+ei
where yi is the response variable (DEBVs or EBVs), μ is the population mean, k is the number of markers, Zij is the allelic state (0, 1, 2) at marker j in individual i, uj is the random substitution effect for marker j, and δj indicates the presence or absence of a marker in the model (0 or 1).
In the case of the threshold, to search for a significant 1 Mb region through GWAS analysis, a region with ≥1% additive genetic variance explanatory power among the total genetic variance that can be explained by SNP markers is defined as a region with a significant effect. The model frequency statistic was estimated and used to select SNP markers with significant effects on each trait. A total of 2,451 1 Mb regions were included in the total region, and the additive dielectric dispersion ratio of each region was approximately 0.041% (100%/2,451).
The BayesB method uses the t-distribution as a prior distribution for SNP marker effects, and is sampled from the prior assumption that each SNP marker has a different variance. This process was performed using the GenSel4R program [15].

RESULTS AND DISCUSSION

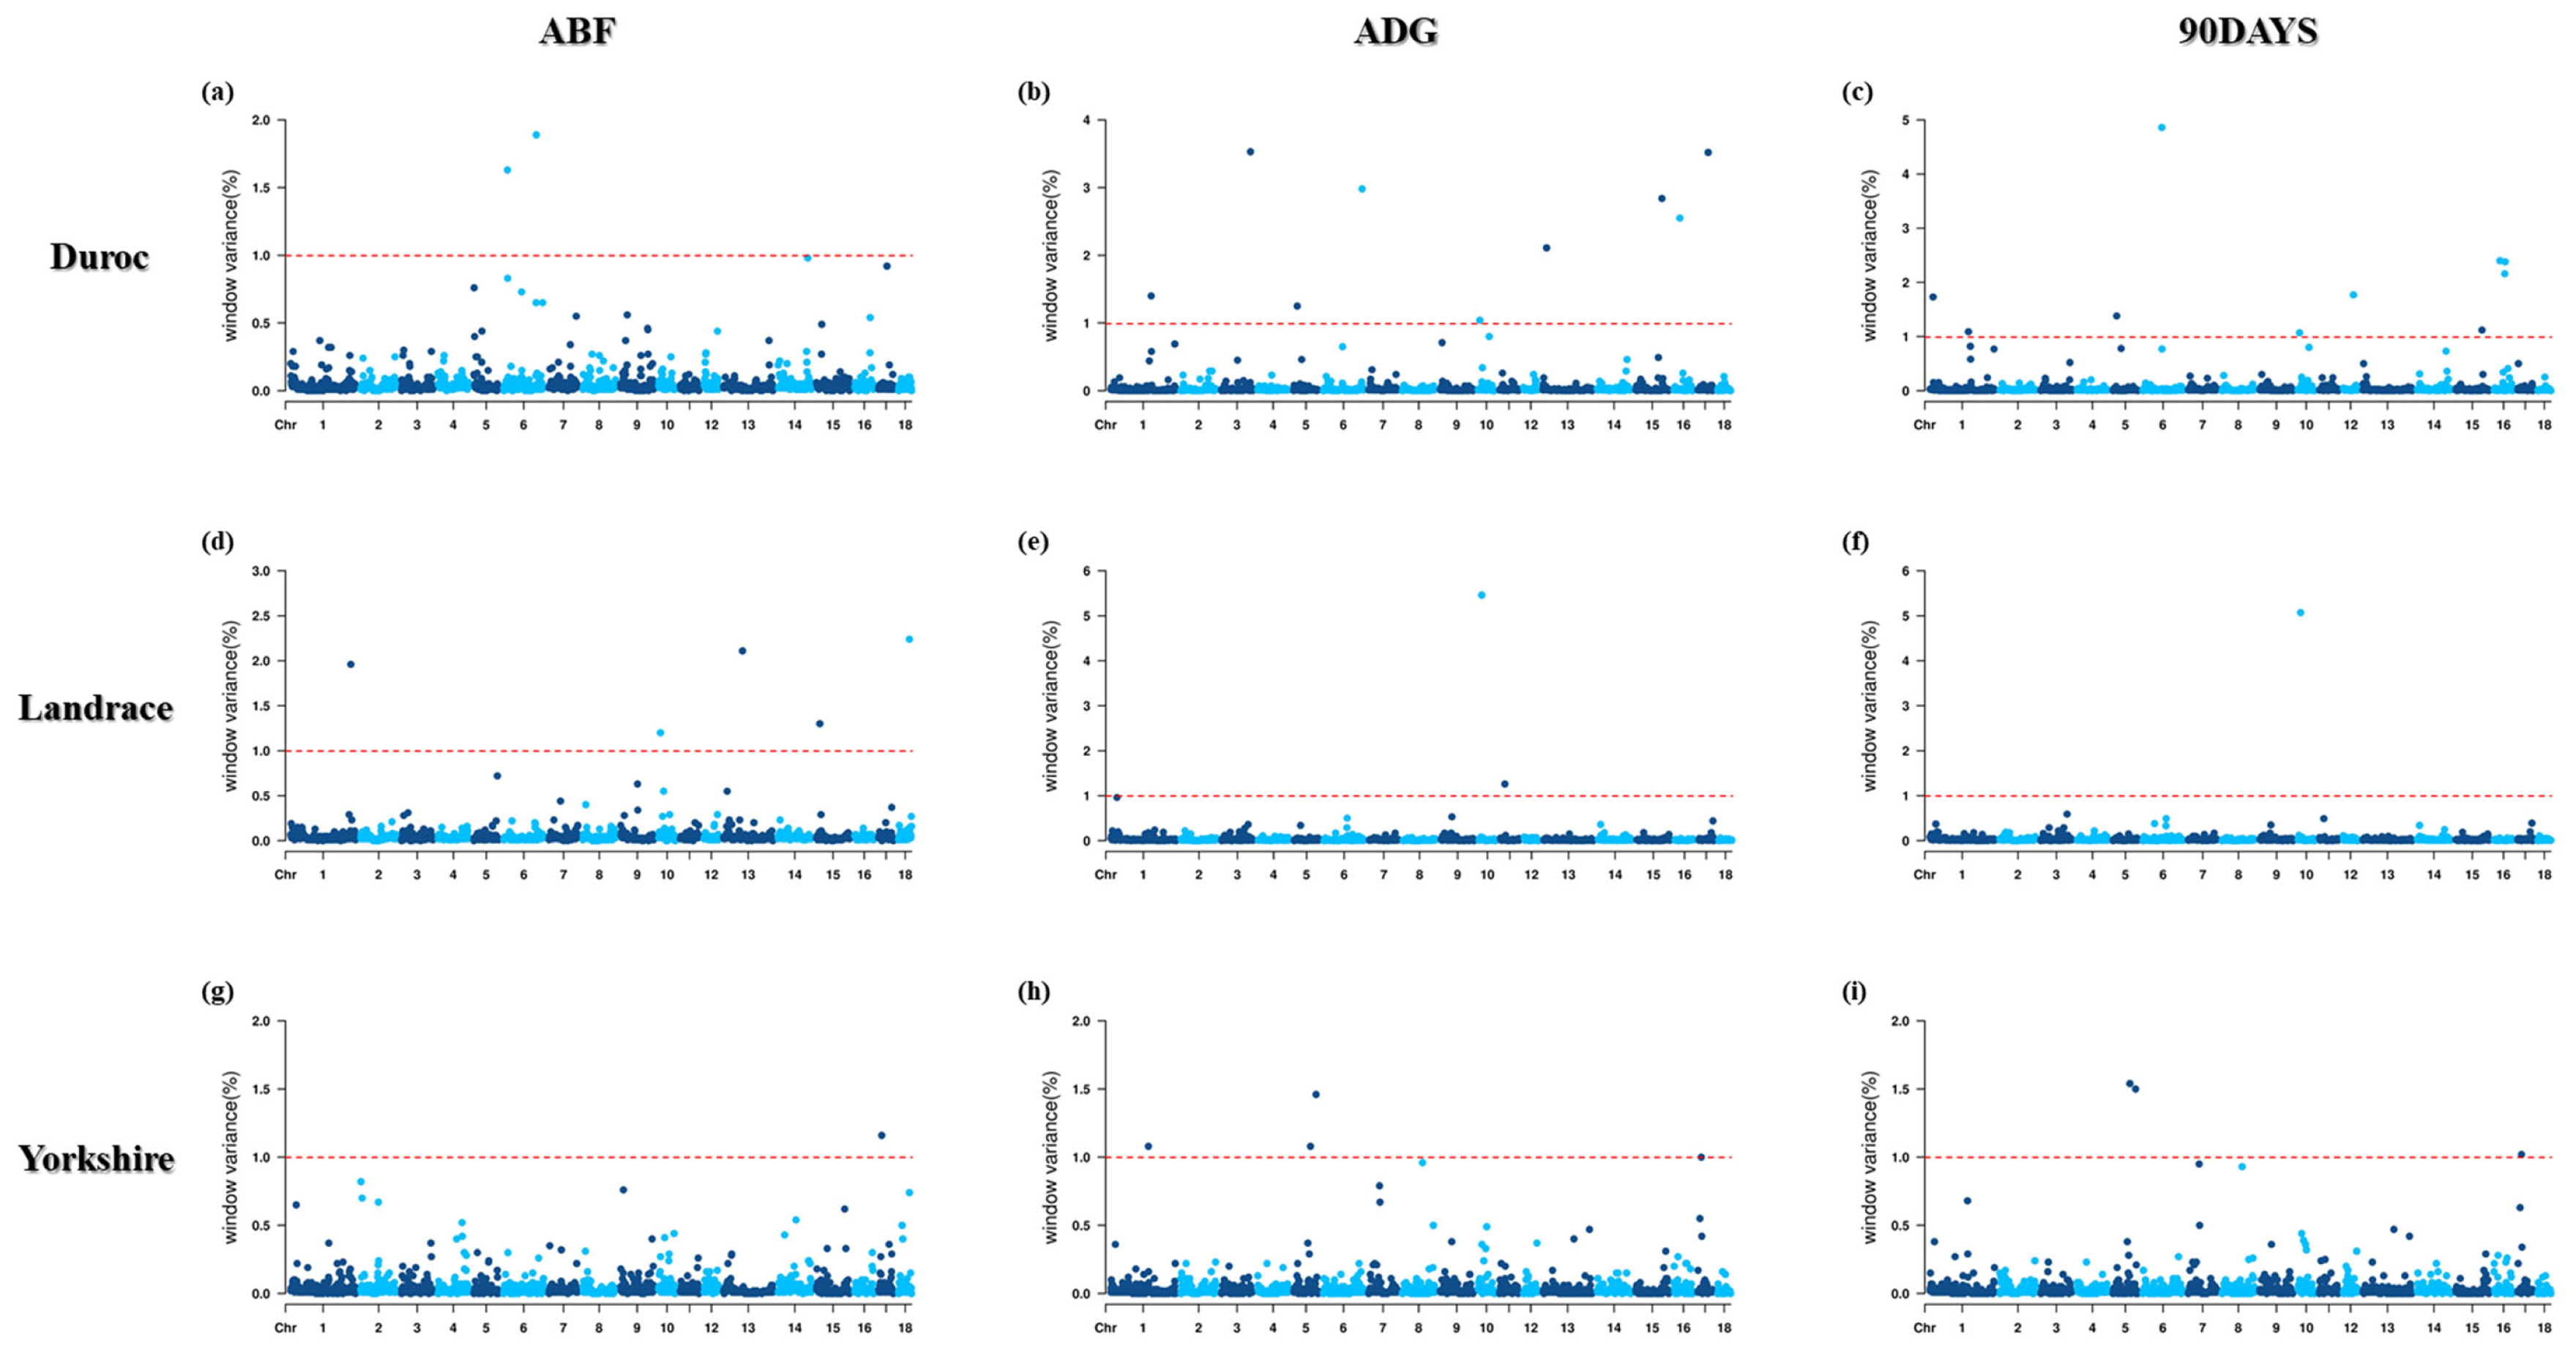
The average ADG for Duroc, Landrace, and Yorkshire pigs was 675±72 g, 646±66 g, and 612±75 g, the ABF was 12.83± 2.40 mm, 12.83±2.60 mm, and 13.73±2.97 mm, and the DAYS90 was 136.7±11.2 days, 143.7±11.6 days, and 148.8± 14.7 days, respectively (Table 3). GWAS was performed using SNP markers imputed to the Illumina PorcineSNP60. Bayesian GWAS applies a threshold for the significance of SNP markers based on significant windows (≥1% genetic variance). A single QTL can affect multiple SNPs because of the high linkage disequilibrium within adjacent SNPs [16].
Therefore, to identify the significant 1 Mb windows, including SNPs, GWAS was performed with three traits (ABF, ADG, and DAYS90) based on BayesB. A total of 28 window regions were found, including 52 informative SNPs based on their genetic effects (Tables 3 to 5; Figure 1).

Adjusted backfat thickness

Analysis found eight significant windows (≥1% genetic variance) with 18 informative SNPs. For ABF, 16 genes were located on Sus Scrofa chromosome (SSC) 6 in Duroc pigs, SSCs 1, 10, 13, 15, and 18 in Landrace pigs, and SSC17 in Yorkshire pigs (Table 4). These regions explained 1.16% to 2.24% of the total genetic variance for ABF, and 17 genes were annotated in these genomic regions.
In Landrace pigs, the most significant 1 Mb window region, explaining 2.24% of the additive genetic variance, was captured on SSC18 at 46 Mb (H3GA0051040). In Duroc pigs, the most significant window, explaining 1.84% of the additive genetic variance, was captured on SSC6 at 138 Mb, and included six SNPs (MARC0037040, M1GA0008914, DRGA 0006864, ASGA0103810, ALGA0113757, and ALGA0036942). In Yorkshire pigs, the most significant window explained 1.16% of the additive genetic variance and was captured on SSC17 at 13 Mb (ASGA0089601).
The NFE2L3 gene adjacent to H3GA0051040, which was the most significant region in Landrace pigs, is required for myoblast differentiation and fusion in cellular processes, autophagy, and endoplasmic reticulum [17], and it is also associated with lipids in humans [18] and pigs [19].
The MRPS22 gene, which located on SSC13 at the 80 Mb region, impairs mitochondrial mRNA translation and lowers coupling efficiency and energy storage, thereby altering the energy balance with potential consequences on lipid accumulation and adiposity [20]. Moreover, it has been suggested as a new susceptibility gene for human obesity [21,22].
All regions associated with ABF in Duroc pigs were found on SSC6. Although there have been no studies related to ABF, many studies have searched for the QTL in this SSC6 region associated with ABF [2325]. In Landrace pigs, the SLC23A2 gene on SSC17 at the 13 Mb region encodes sodium-coupled vitamin C transporter 2 (SVCT2), whose expression may be regulated by insulin-like growth factor signaling [26]. Similarly, its association with ABF has not been studied. Thus, research using a high-density genotyping chip is needed to identify the region.

Average daily gain

For ADG, 25 informative SNPs were identified in 10 significant window regions (≥1% genetic variance) (Table 5). These regions explained 1.00% to 5.46% of the total genetic variance for ADG, and 31 genes were annotated in these genomic regions. Candidate regions associated with ADG were identified in SSCs 1, 3, 5, 6, 10, 13, 15, and 17 in Duroc pigs, SSCs 10 and 11 in Landrace pigs, and SSCs 1, 5, and 17 in Yorkshire pigs.
In Landrace pigs, the most significant 1 Mb window region explained 5.46% of the additive genetic variance and was captured on SSC10 at the 11 Mb region (DRGA0010301). In Duroc pigs, the most significant window explained 3.53% of the genetic variance and was captured on SSC3 at the 123 Mb region (MARC0091117). In Yorkshire pigs, the most significant window explained 1.46% of the genetic variance and was captured on SSC5 at the 95 Mb region (ASGA0026863).
The FAM177B gene adjacent to SSC10 at the 11 Mb region, which was the region most significantly related to ADG, is related to body size in Hulun Buir sheep [27]. The TRIB2 gene, which is close to SSC3 at the 123 Mb region, the most significant region in Duroc pigs, is related to growth traits in Thoroughbred pigs [28]. The RBMS3 gene, which is close to SSC13 at the 15 Mb region, is related to growth traits in cattle [29].
In Yorkshire pigs, the MGAT4C gene close to SSC5 at the 95 Mb region coincided with the region discovered in a study on Nero Siciliano pigs [30], which is also consistent with the results of a study on Italian Large White pigs [31].
The RNF152 gene adjacent to SSC1 at the 159 Mb region coincided with the region discovered in a study on ADG in Landrace×Large Whites [32] and that discovered in a study on ABF and DAYS100 in Duroc pigs. Lee et al [16] examined ABF, DAYS90, loin muscle area, and lean percentage in Duroc pigs.
The FERMT1 gene adjacent to SSC17 at the 15 Mb region positively regulates the transforming growth factor beta (TGF-beta) receptor signaling pathway in pigs and is significantly associated with carcass length. The BMP2 gene is involved in the TGF-beta signaling pathway, playing a role in bone and cartilage development, and has been proposed as a strong candidate gene for carcass length [33]. In addition, it has been associated with body weight and body conformation traits in pigs [27].

Days to 90 kg

For DAYS90, 25 SNPs were identified in eight significant windows (≥1% genetic variance) (Table 6). The candidate regions associated with DAYS90 were identified at SSCs 1, 5, 6, 10, 12, 15, and 16 in Duroc pigs, SSC10 in Landrace pigs, and SSCs 5 and 17 in Yorkshire pigs. These regions explained 1.02% to 5.07% of the total genetic variance, and 28 genes were annotated in these genomic regions.
In Landrace pigs, the most significant 1 Mb window region explained 5.07% of the additive genetic variance and was captured on SSC10 at the 11 Mb region (DRGA0010301). In Duroc pigs, the most significant region, explaining 4.86% of the variance, was captured on SSC6 at the 80 Mb region (H3GA0018314). In Yorkshire pigs, the most significant region explained 1.54% and was captured on SSC5 at the 71 Mb region (INRA0019895, ASGA0026241, ASGA0026236, and ALGA0032782).
The LACTBL1 gene is located on SSC6 at the 80 Mb region, the most significant region in Duroc pigs, and has been associated with weight among the British population [34].
The FAIM2 gene, which is located on SSC5 at the 15 Mb region, is correlated with muscle mass in cattle and it is a candidate gene for growth and carcass traits [35]. It is also closely related to obesity in humans, and many studies have been conducted with the MC4R gene [36,37]. NCKAP5L, located at the same position, has also been reported as a candidate gene for daily weight gain, which is a growth trait in cattle [38,39].
PIK3R1, located on SSC6 at the 45 Mb region, is directly related to lipid metabolism [40] and is involved in skeletal muscle differentiation and proliferation [41]. In addition, Chen et al [42] reported that it regulates feed intake and fat deposition in Chinese Laiwu pigs, while another study reported a QTL closely related to backfat thickness in pigs [43,44].
For the identified significant regions, there were six overlapping windows for ADG and DAYS90, which explained the different proportions of genetic variance in these two traits. For complex quantitative traits, it was assumed that the linear effects of genes fit the average of the traits completely. However, in practice, the effects of genes are not always linear for traits, and the nonlinear assumption is more appropriate, which means that genes contribute differently and QTL has pleiotropic effects between traits. The region with the largest explained genetic variance for ADG and DAYS90, located on SSC10 at the 57 Mb region, seemingly had pleiotropic effects on growth traits in pigs.

CONCLUSION

We identified 28 significant window regions associated with three growth traits (ABF, ADG, and DAYS90) in Duroc, Landrace, and Yorkshire pig populations using the Bayesian GWAS method. The genetic variance of the identified windows varied from 1.00% to 5.46%.
Furthermore, 14 genes with related functional validation in previous studies were identified as candidate genes for growth traits. Such a full use of phenotypic and genotypic data and genealogical information will further advance our understanding of genetic architecture and accelerate the genetic improvement of economically important traits in pigs. In addition, the SNPs within the identified regions may be useful for marker-assisted selection or genomic selection in future pig breeding programs.

Notes

CONFLICT OF INTEREST

We certify that there is no conflict of interest with any financial organization regarding the material discussed in the manuscript. Jung JH is an employee of Jung P&C Institute.

FUNDING

The authors received no financial support for this article.

Figure 1
Manhattan plots for genome-wide association study (GWAS) based on Bayesian B (BayesB) methods of adjusted backfat thickness (ABF), average dairy gain (ADG), days to 90 (90DAYS) by pig breeds.
ab-23-0443f1.jpg
Table 1
Basic statistics of single-nucleotide polymorphism data set
Breed Description Commercial genotyping platforms

Axiom 53K Axiom 650K Illumina 60Kv2
Duroc Total number of animals - 211 818
No. duplicated animals - 11 25
No. target animals - 200 764
No. reference animals - - 159
No. genotyped animals after imputation - - 923
Total number of SNPs - 658,692 61,565
No. markers on autosome - 592,052 58,863
No, Selected markers after QC - 592,024 58,845
No. markers for analysis - - 43,861
Landrace Total no. of animals - 143 329
No. duplicated animals - 11 28
No. reference animals - 132 301
No. target animals - - 132
No. genotyped animals after imputation - - 433
Total no. of SNPs - 658,692 61,565
Markers on autosome - 592,052 58,863
Selected markers after QC - 592,024 58,845
No. markers for analysis - - 52,580
Yorkshire Total no. of animals 479 393 2,932
No. duplicated animals 50 30 301
No. reference animals 429 364 2,631
No. target animals - - 2,631
No. genotyped animals after imputation - - 3,424
Total no. of SNPs 55,374 658,692 61,565
Markers on autosome 49,732 592,052 58,863
Selected markers after QC 49,624 592,024 58,845
No. markers for analysis - - 52,403

SNP, single-nucleotide polymorphism; QC, quality control.

Table 2
Variance components and heritabilities for adjusted backfat thickness, average dairy gain, days to 90 kg by pig breed
Breeds Trait Genetic variance Residual variance Phenotypic variance Heritability
Duroc ADG 0.12 0.30 0.42 0.28
ABF 1.55 2.88 4..43 0.35
DAYS90 0.29 0.68 0.97 0.30
Landrace ADG 0.12 0.22 0.34 0.35
ABF 2.24 2.88 5.12 0.44
DAYS90 0.36 0.60 0.96 0.37
Yorkshire ADG 0.12 0.23 0.35 0.33
ABF 3.04 3.97 7.01 0.43
DAYS90 0.39 0.83 1.22 0.32

ABF, adjusted backfat thickness; ADG, average daily gain; DAYS90, days to 90 kg.

Table 3
Frequencies, means and standard deviations for adjusted backfat thickness, average dairy gain, days to 90 kg by pig breed
Breeds Sex N ABF (mm) ADG (g) DAYS90 (d)
Duroc Boar 17,523 12.74±2.02 684.74±70.29 134.05±10.38
Gilt 21,418 12.86±2.56 670.61±73.85 138.64±11.18
Total 38,941 12.83±2.40 675.01±72.21 136.71±11.21
Landrace Boar 10,084 12.71±2.73 643.74±60.56 140.35±10.42
Gilt 13,367 12.93±2.42 648.59±64.29 145.55±12.29
Total 23,451 12.83±2.60 646.21±66.22 143.74±11.62
Yorkshire Boar 36,458 13.55±2.54 608.74±71.10 145.64±13.58
Gilt 54,688 13.97±2.48 620.49±70.97 149.77±13.96
Total 91,146 13.73±2.97 612.13±75.10 148.82±14.73

ABF, adjusted backfat thickness; ADG, average daily gain; DAYS90, days to 90 kg.

Table 4
Summary of informative single-nucleotide polymorphisms in the significant 1-Mb windows for adjusted backfat thickness by breed
Breed1) SSC_Mb GV (%) Informative SNP Position Effect Model frequency Region annotation Gene annotation
DD 6_138 1.89 MARC0037040 138.70 0.055 0.132 Intergenic CRYZ (dist = 11,423)
FPGT (dist = 470,843)
M1GA0008914 138.50 0.070 0.161 Intergenic LHX8 (dist = 152,772)
TYW3 (dist = 163,579)
DRGA0006864 138.20 −0.030 0.081 Intergenic LHX8 (dist = 222,275)
TYW3 (dist = 94,076)
ASGA0103810 138.00 0.018 0.057 Intergenic LHX8 (dist = 341)
TYW3 (dist = 316,010)
ALGA0113757 138.60 −0.021 0.064 Intergenic CRYZ (dist = 299,075)
FPGT (dist = 183,191)
ALGA0036942 138.90 0.029 0.079 Intergenic CRYZ (dist = 36,545)
FPGT (dist = 445,721)
6_16 1.63 MARC0033972 16.80 0.109 0.260 Intergenic U6 (dist = 635,716)
PSMD7 (dist = 58,944)
MARC0029800 16.40 0.053 0.142 Intergenic U6 (dist = 592,247)
PSMD7 (dist = 102,413)
ALGA0034650 16.30 0.063 0.159 Intergenic U6 (dist = 482,216)
PSMD7 (dist = 212,444)
LL 18_46 2.24 H3GA0051040 46.94 0.280 0.551 Intergenic NFE2L3 (dist = 690,741)
NPVF (dist = 141,966)
13_80 2.11 ALGA0071112 80.14 0.288 0.390 Intronic MRPS22
1_254 1.96 ALGA0009437 254.44 0.309 0.459 Intergenic RGS3 (dist = 232,910)
ZNF618 (dist = 33,149)
15_14 1.3 H3GA0043799 14.01 −0.051 0.141 Intergenic HNMT (dist = 244,837)
THSD7B (dist = 75,963)
ALGA0084000 14.03 0.065 0.170 Intergenic HNMT (dist = 265,141)
THSD7B (dist = 55,659)
ALGA0083995 14.05 −0.052 0.142 Intergenic HNMT (dist = 286,129)
THSD7B (dist = 34,671)
ALGA0083978 14.30 −0.015 0.053 Intronic THSD7B
10_7 1.2 ALGA0056744 7.31 0.161 0.357 Intergenic ESRRG (dist = 289572)
GPATCH2 (dist = 295957)
YY 17_13 1.16 ASGA0089601 13.97 0.725 0.843 Intronic SLC23A2

SSC, Sus Scrofa chromosome; GV, genetic variance; SNP, single-nucleotide polymorphism.

1) DD, Duroc; LL, Landrace; YY, Yorkshire.

Table 5
Summary of informative single-nucleotide polymorphisms in the significant 1-Mb windows for average daily gain by breed
Breed1) SSC_Mb GV (%) Informative SNP Position Effect Model frequency Region annotation Gene annotation
DD 3_123 3.53 MARC0091117 123.40 −1.122 0.673 Intergenic U2 (dist = 481,335)
TRIB2 (dist = 426,227)
17_44 3.52 MARC0028846 44.00 1.430 0.663 Intergenic CHD6 (dist = 421,373)
PTPRT (dist = 27,816)
6_164 2.98 ASGA0098375 164.10 2.335 0.339 Intronic MKNK1
15_111 2.84 ALGA0086770 111.00 0.672 0.350 Intergenic U2 (dist = 1,253)
MAP2 (dist = 527,654)
16_25 2.55 ASGA0072766 25.00 −0.033 0.126 Intergenic U2 (dist = 496,722)
PTGER4 (dist = 392,964)
ALGA0089851 25.00 −0.037 0.143 Intergenic U2 (dist = 563,131)
PTGER4 (dist = 326,555)
ALGA0089849 25.00 0.047 0.171 Intergenic U2 (dist = 529,039)
PTGER4 (dist = 360,647)
13_15 2.11 ALGA0120330 15.00 0.199 0.668 Intergenic ZCWPW2 (dist = 312,619)
RBMS3 (dist = 472,631)
1_171 1.4 MARC0001172 171.80 0.067 0.291 Intergenic FBXO33 (dist = 1,166,208)
U6 (dist = 188,990)
5_15 1.25 M1GA0007662 15.30 0.065 0.304 Intergenic FAIM2 (dist = 26,363)
AQP2 (dist = 24,393)
ASGA0024735 15.30 0.045 0.250 Intronic NCKAP5L
10_7 1.04 M1GA0013649 7.00 0.010 0.084 Intronic GPATCH2
DRGA0010240 7.00 0.011 0.074 Intronic SPATA17
DRGA0010231 7.00 −0.098 0.438 Intergenic ESRRG (dist = 488,896)
GPATCH2 (dist = 96,633)
LL 10_11 5.46 DRGA0010301 11.51 0.916 0.9159 Intergenic FAM177B (dist = 17,005)
DISP1 (dist = 7,902)
11_18 1.26 MARC0113984 18.00 0.056 0.0563 Intronic RCBTB1
CASI0005912 18.11 0.349 0.3486 Intronic EBPL, ARL11
ALGA0061162 18.12 0.052 0.0518 Intronic RCBTB1
YY 5_95 1.46 ASGA0026863 95.04 0.257 0.992 Intergenic C12orf50 (dist = 521,803)
MGAT4C (dist = 1,138,851)
5_71 1.08 ASGA0026241 71.33 0.011 0.191 Intronic SLC2A13
ASGA0026236 71.16 0.056 0.338 Intronic ABCD2
ALGA0032782 71.20 −0.118 0.450 Intronic C12orf40
1_159 1.08 ALGA0006599 159.66 0.093 0.770 Intergenic RNF152 (dist = 58,322)
CDH20 (dist = 157,254)
17_15 1.00 INRA0052808 15.89 0.042 0.493 Intergenic BMP2 (dist = 135,631)
HAO1 (dist = 847,594)
INRA0052780 15.65 0.041 0.460 Intergenic FERMT1 (dist = 522,008)
BMP2 (dist = 90,074)

SNP, single-nucleotide polymorphism; ADG, average daily gain; SSC, Sus Scrofa chromosome; GV, genetic variance.

1) DD, Duroc; LL, Landrace; YY, Yorkshire.

Table 6
Summary of informative single-nucleotide polymorphisms in the significant 1-Mb windows for 90DAYS by breeds
Breed1) SSC_Mb GV (%) Informative SNP Position Effect Model frequency Region annotation Gene annotation
DD 6_80 4.86 H3GA0018314 80.70 2.035 0.723 Intronic LACTBL1
5_15 1.38 M1GA0007662 15.30 −0.048 0.175 Intergenic FAIM2 (dist = 26,363)
AQP2 (dist = 24,393)
ASGA0024735 15.30 −0.111 0.382 Intronic NCKAP5L
16_47 2.38 MARC0030690 47.00 −1.396 0.390 Intergenic PIK3R1 (dist = 500,109)
SLC30A5 (dist = 261,000)
16_45 2.16 MARC0002703 45.00 1.228 0.329 Intergenic CD180 (dist = 242,747)
PIK3R1 (dist = 604,060)
16_25 2.4 ASGA0072766 25.00 0.040 0.105 Intergenic U2 (dist = 496,722)
PTGER4 (dist = 392,964)
ALGA0089851 25.00 0.048 0.126 Intergenic U2 (dist = 563,131)
PTGER4 (dist = 326,555)
ALGA0089849 25.00 −0.060 0.153 Intergenic U2 (dist = 529,039)
PTGER4 (dist = 360,647)
15_111 1.12 ALGA0086770 111.00 −0.484 0.247 Intergenic U2 (dist = 1,253)
MAP2 (dist = 527,654)
12_43 1.77 ALGA0116086 43.00 0.110 0.276 Intronic RAB11FIP4
1_163 1.09 MARC0004843 163.30 0.016 0.088 Intronic IGDCC4
ASGA0005079 163.40 0.036 0.148 Intergenic IGDCC4 (dist = 7,455)
DPP8 (dist = 3,381)
ALGA0006725 163.80 −0.089 0.311 Intronic IGDCC4
1_13 1.73 ALGA0001167 13.30 −1.600 0.282 Intergenic MYCT1 (dist = 141,875)
ESR1 (dist = 386,485)
10_7 1.07 M1GA0013649 7.00 −0.013 0.075 Intronic GPATCH2
DRGA0010240 7.00 −0.035 0.144 Intronic SPATA17
DRGA0010231 7.00 0.109 0.321 Intergenic ESRRG (dist = 488,896)
GPATCH2 (dist = 96,633)
LL 10_11 5.07 DRGA0010301 11.51 −0.342 0.861 Intergenic FAM177B (dist = 17,005)
DISP1 (dist = 7,902)
YY 5_71 1.54 INRA0019895 71.30 0.121 0.194 Intronic SLC2A13
ASGA0026241 71.33 −0.023 0.216 Intronic SLC2A13
ASGA0026236 71.16 −0.142 0.387 Intronic ABCD2
ALGA0032782 71.20 0.220 0.434 Intronic C12orf40
5_95 1.5 ASGA0026863 95.04 −0.459 0.990 Intergenic C12orf50 (dist = 521,803)
MGAT4C (dist = 1,138,851)
17_15 1.02 INRA0052808 15.89 −0.062 0.416 Intergenic BMP2 (dist = 135,631)
HAO1 (dist = 847,594)
INRA0052780 15.65 −0.089 0.563 Intergenic FERMT1 (dist = 522,008)
BMP2 (dist = 90,074)

SNP, single-nucleotide polymorphism; SSC, Sus Scrofa chromosome; GV, genetic variance; DAYS90, days to 90 kg.

1) DD, Duroc; LL, Landrace; YY, Yorkshire.

REFERENCES

1. Kang HS, Nam KC, Li Y, Kim KT, Yoon JT, Seo KS. Estimation of genetic parameters and genetic trends for major economic traits in swine. J Anim Sci Technol 2012; 54:89–94. https://doi.org/10.5187/JAST.2012.54.2.89
crossref
2. Cho KH, Kim SH, Park KD. Changes rate in selection of Yorkshire pig for productive traits using the integrated test records among GGPs. J Korean Data Inform Sci Soc 2016; 27:429–35. https://doi.org/10.7465/jkdi.2016.27.2.429
crossref
3. Choi JG, Cho CI, Choi IS, et al. Genetic parameter estimation in seedstock swine population for growth performances. Asian-Australas J Anim Sci 2013; 26:470–5. https://doi.org/10.5713/ajas.2012.12454
crossref pmid pmc
4. Ruan D, Zhuang Z, Ding R, et al. Weighted single-step GWAS identified candidate genes associated with growth traits in a Duroc pig population. Genes 2021; 12:117 https://doi.org/10.3390/genes12010117
crossref pmid pmc
5. Andersson L, Georges M. Domestic-animal genomics: deciphering the genetics of complex traits. Nat Rev Genet 2004; 5:202–12. https://doi.org/10.1038/nrg1294
crossref pmid
6. Balding DJ. A tutorial on statistical methods for population association studies. Nat Rev Genet 2006; 7:781–91. https://doi.org/10.1038/nrg1916
crossref pmid
7. Hirschhorn JN, Daly MJ. Genome-wide association studies for common diseases and complex traits. Nat Rev Genet 2005; 6:95–108. https://doi.org/10.1038/nrg1521
crossref pmid
8. Sun X, Habier D, Fernando RL, Garrick DJ, Dekkers JCM. Genomic breeding value prediction and QTL mapping of QTLMAS2010 data using Bayesian methods. BMC Proc 2011; 5:Suppl 3S13 https://doi.org/10.1186/1753-6561-5-S3-S13
crossref pmid pmc
9. Hoeschele I, Uimari P, Grignola FE, Zhang Q, Gage KM. Advances in statistical methods to map quantitative trait loci in outbred populations. Genetics 1997; 147:1445–57. https://doi.org/10.1093/genetics/147.3.1445
crossref pmid pmc
10. Zou W, Zeng ZB. Statistical methods for mapping multiple QTL. Int J Plant Genomics 2008; 2008:286561 https://doi.org/10.1155/2008/286561
crossref pmid pmc
11. Sargolzaei M, Chesnais JP, Schenkel FS. A new approach for efficient genotype imputation using information from relatives. BMC Genomics 2014; 15:478 https://doi.org/10.1186/1471-2164-15-478
crossref pmid pmc
12. Gilmour AR, Gogel BJ, Cullis BR, Welham SJ, Thompson R. ASReml user guide release 4.1 structural specification. Hemel hempstead, England: VSN international ltd; 2015.

13. Saatchi M, Schnabel RD, Rolf MM, Taylor JF, Garrick DJ. Accuracy of direct genomic breeding values for nationally evaluated traits in US Limousin and Simmental beef cattle. Genet Sel Evol 2012; 44:38 https://doi.org/10.1186/1297-9686-44-38
crossref pmid pmc
14. Kizilkaya K, Fernando RL, Garrick DJ. Genomic prediction of simulated multibreed and purebred performance using observed fifty thousand single nucleotide polymorphism genotypes. J Anim Sci 2010; 88:544–51. https://doi.org/10.2527/jas.2009-2064
crossref pmid
15. Garrick DJ, Fernando RL. Implementing a QTL detection study (GWAS) using genomic prediction methodology. Gondro C, van der Werf J, Hayes B, editorsGenome-wide association studies and genomic prediction. Totowa, New Jersey, USA: Humana Press; 2013. p. 275–98. https://doi.org/10.1007/978-1-62703-447-0_11
crossref pmid
16. Lee JJ, Lee SH, Park JE, et al. Genome-wide association study and genomic predictions for exterior traits in Yorkshire pigs. J Anim Sci 2019; 97:2793–802. https://doi.org/10.1093/jas/skz158
crossref pmid pmc
17. Keever MR. Comparison of the molecular phenotypes of pigs carrying different IGF2 alleles at four developmental time points [master’s thesis]. Champaign, IL, USA: University of Illinois at Urbana-Champaign; 2017.

18. Casas-Agustench P, Arnett DK, Smith CE, et al. Saturated fat intake modulates the association between an obesity genetic risk score and body mass index in two US populations. J Acad Nutr Diet 2014; 114:1954–66. https://doi.org/10.1016/j.jand.2014.03.014
crossref pmid pmc
19. Welzenbach J, Neuhoff C, Heidt H, et al. Integrative analysis of metabolomic, proteomic and genomic data to reveal functional pathways and candidate genes for drip loss in pigs. Int J Mol Sci 2016; 17:1426 https://doi.org/10.3390/ijms17091426
crossref pmid pmc
20. Haque ME, Grasso D, Miller C, Spremulli LL, Saada A. The effect of mutated mitochondrial ribosomal proteins S16 and S22 on the assembly of the small and large ribosomal subunits in human mitochondria. Mitochondrion 2008; 8:254–61. https://doi.org/10.1016/j.mito.2008.04.004
crossref pmid pmc
21. Comuzzie AG, Cole SA, Laston SL, et al. Novel genetic loci identified for the pathophysiology of childhood obesity in the Hispanic population. PloS one 2012; 7:e51954 https://doi.org/10.1371/journal.pone.0051954
crossref pmid pmc
22. Melka MG, Bernard M, Mahboubi A, et al. Genome-wide scan for loci of adolescent obesity and their relationship with blood pressure. J Clin Endocrinol Metab 2012; 97:E145–50. https://doi.org/10.1210/jc.2011-1801
crossref pmid
23. Grindflek E, Szyda J, Liu Z, Lien S. Detection of quantitative trait loci for meat quality in a commercial slaughter pig cross. Mamm Genome 2001; 12:299–304. https://doi.org/10.1007/s003350010278
crossref pmid
24. Li X, Kim SW, Choi JS, et al. Investigation of porcine FABP3 and LEPR gene polymorphisms and mRNA expression for variation in intramuscular fat content. Mol Biol Rep 2010; 37:3931–9. https://doi.org/10.1007/s11033-010-0050-1
crossref pmid
25. Óvilo C, Fernández A, Noguera JL, et al. Fine mapping of porcine chromosome 6 QTL and LEPR effects on body composition in multiple generations of an Iberian by Landrace intercross. Genet Res 2005; 85:57–67. https://doi.org/10.1017/s0016672305007330
crossref pmid
26. Chothe PP, Chutkan N, Sangani R, et al. Sodium-coupled vitamin C transporter (SVCT2): expression, function, and regulation in intervertebral disc cells. Spine J 2013; 13:549–57. https://doi.org/10.1016/j.spinee.2013.01.022
crossref pmid
27. Zhang T, Gao H, Sahana G, et al. Genome-wide association studies revealed candidate genes for tail fat deposition and body size in the Hulun Buir sheep. J Anim Breed Genet 2019; 136:362–70. https://doi.org/10.1111/jbg.12402
crossref pmid
28. Tozaki T, Kikuchi M, Kakoi H, Hirota KI, Nagata SI. A genome-wide association study for body weight in Japanese Thoroughbred racehorses clarifies candidate regions on chromosomes 3, 9, 15, and 18. J Equine Sci 2017; 28:127–34. https://doi.org/10.1294/jes.28.127
crossref pmid pmc
29. Widmann P, Reverter A, Fortes MRS, et al. A systems biology approach using metabolomic data reveals genes and pathways interacting to modulate divergent growth in cattle. BMC Genomics 2013; 14:798 https://doi.org/10.1186/1471-2164-14-798
crossref pmid pmc
30. D’Alessandro E, Sottile G, Sardina MT, et al. Genome-wide analyses reveal the regions involved in the phenotypic diversity in Sicilian pigs. Anim Genet 2020; 51:101–5. https://doi.org/10.1111/age.12887
crossref pmid
31. Fontanesi L, Schiavo G, Galimberti G, Calò DG, Russo V. A genomewide association study for average daily gain in Italian Large White pigs. J Anim Sci 2014; 92:1385–94. https://doi.org/10.2527/jas.2013-7059
crossref pmid
32. Silva ÉF, Lopes MS, Lopes PS, Gasparino E. A genome-wide association study for feed efficiency-related traits in a crossbred pig population. Animal 2019; 13:2447–56. https://doi.org/10.1017/S1751731119000910
crossref pmid
33. Blaj I, Tetens J, Preuß S, Bennewitz J, Thaller G. Genome-wide association studies and meta-analysis uncovers new candidate genes for growth and carcass traits in pigs. PLoS one 2018; 13:e0205576 https://doi.org/10.1371/journal.pone.0205576
crossref pmid pmc
34. Tachmazidou I, Süveges D, Min JL, et al. Whole-genome sequencing coupled to imputation discovers genetic signals for anthropometric traits. Am J Hum Genet 2017; 100:865–84. https://doi.org/10.1016/j.ajhg.2017.04.014
crossref
35. Wang LJ, Liu XL, Wang HI, He H, Li ZX, Chen L. Expression analysis, single nucleotide polymorphisms and combined genotypes in candidate genes and their associations with growth and carcass traits in Qinchuan cattle. Mol Biol Rep 2013; 40:2335–46. https://doi.org/10.1007/s11033-012-2315-3
crossref pmid
36. Hotta K, Nakamura M, Nakamura T, et al. Association between obesity and polymorphisms in SEC16B, TMEM18, GNPDA2, BDNF, FAIM2 and MC4R in a Japanese population. J Hum Genet 2009; 54:727–31. https://doi.org/10.1038/jhg.2009.106
crossref pmid
37. León-Mimila P, Villamil-Ramirez H, Villalobos-Comparan M, et al. Contribution of common genetic variants to obesity and obesity-related traits in mexican children and adults. PLoS one 2013; 8:e70640 https://doi.org/10.1371/journal.pone.0070640
crossref pmid pmc
38. Serão NVL, González-Peña D, Beever JE, et al. Bivariate genome-wide association analysis of the growth and intake components of feed efficiency. PLoS one 2013; 8:e78530 https://doi.org/10.1371/journal.pone.0078530
crossref pmid pmc
39. Valente TS, Baldi F, Sant’Anna AC, Albuquerque LG, Paranhos da Costa MJR. Genome-wide association study between single nucleotide polymorphisms and flight speed in Nellore cattle. PLoS One 2016; 11:e0156956 https://doi.org/10.1371/journal.pone.0156956
crossref pmid pmc
40. Puig-Oliveras A, Revilla M, Castelló A, Fernández AI, Folch JM, Ballester M. Expression-based GWAS identifies variants, gene interactions and key regulators affecting intramuscular fatty acid content and composition in porcine meat. Sci Rep 2016; 6:31803 https://doi.org/10.1038/srep31803
crossref pmid pmc
41. Jing L, Hou Y, Wu H, et al. Transcriptome analysis of mRNA and miRNA in skeletal muscle indicates an important network for differential residual feed intake in pigs. Sci Rep 2015; 5:11953 https://doi.org/10.1038/srep11953
crossref pmid pmc
42. Chen M, Wang J, Wang Y, Wu Y, Fu J, Liu JF. Genome-wide detection of selection signatures in Chinese indigenous Laiwu pigs revealed candidate genes regulating fat deposition in muscle. BMC Genet 2018; 19:31 https://doi.org/10.1186/s12863-018-0622-y
crossref pmid pmc
43. Puig-Oliveras A, Ramayo-Caldas Y, Corominas J, et al. Differences in muscle transcriptome among pigs phenotypically extreme for fatty acid composition. PLoS one 2014; 9:e99720 https://doi.org/10.1371/journal.pone.0099720
crossref pmid pmc
44. Ramayo-Caldas Y, Mercadé A, Castelló A, et al. Genome-wide association study for intramuscular fatty acid composition in an Iberian× Landrace cross. J Anim Sci 2012; 90:2883–93. https://doi.org/10.2527/jas.2011-4900
crossref pmid


Editorial Office
Asian-Australasian Association of Animal Production Societies(AAAP)
Room 708 Sammo Sporex, 23, Sillim-ro 59-gil, Gwanak-gu, Seoul 08776, Korea   
TEL : +82-2-888-6558    FAX : +82-2-888-6559   
E-mail : editor@animbiosci.org               

Copyright © 2024 by Asian-Australasian Association of Animal Production Societies.

Developed in M2PI

Close layer
prev next